
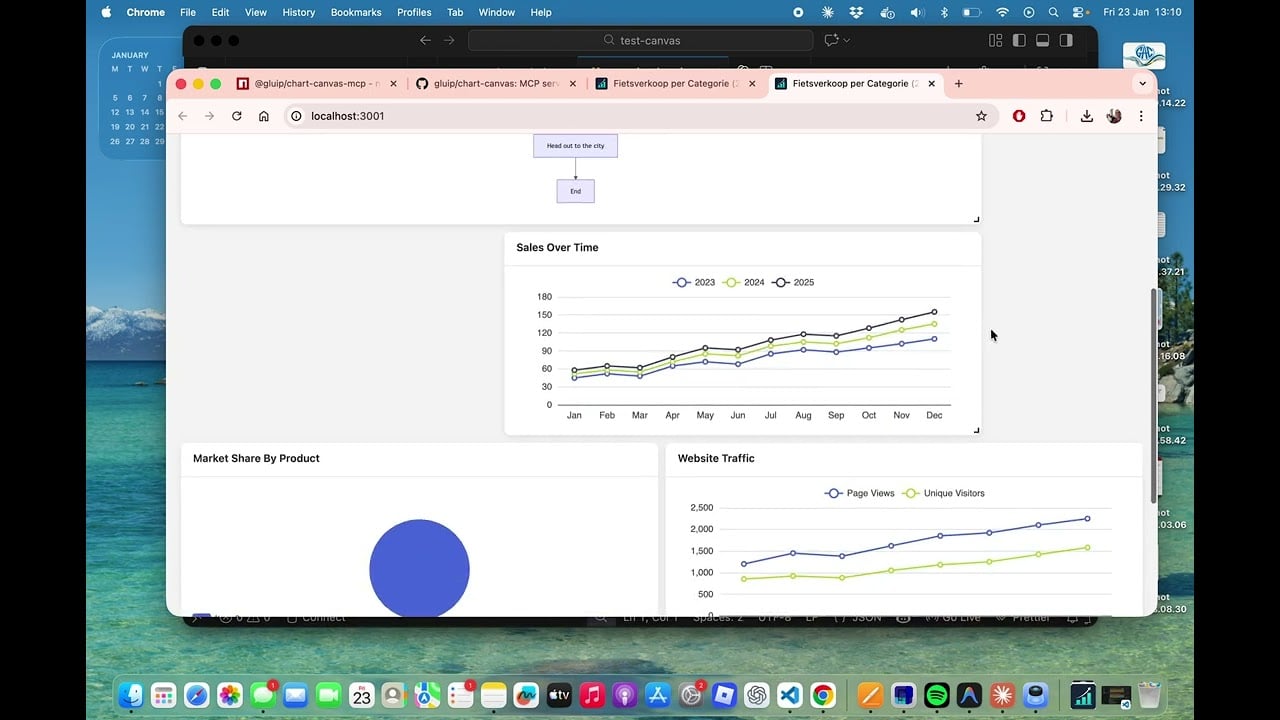
About Chart Canvas
Chart Canvas is an interactive visualization dashboard that integrates with AI assistants and the Model Context Protocol (MCP). It enables users to create, view, and update charts, diagrams, and tables in real time, based on data queried from multiple file formats (SQLite, CSV, Parquet, JSON, NDJSON) directly during AI conversations (e.g., with Claude Desktop). Data remains local to the user, ensuring privacy. This tool is designed for users looking for seamless, privacy-first charting and data visualization alongside their AI workflows.
Resources
Product Website
Visit Chart Canvas's official website for product details and getting started.
Documentation
Comprehensive API reference and integration guides for using Chart Canvas effectively.
Getting Started Guide
A helpful guide to quickly set up and start using Chart Canvas for your projects.
Example Usage
Explore example projects and use cases to better understand Chart Canvas capabilities.